


Generating App Views Using Model Driven Engineering

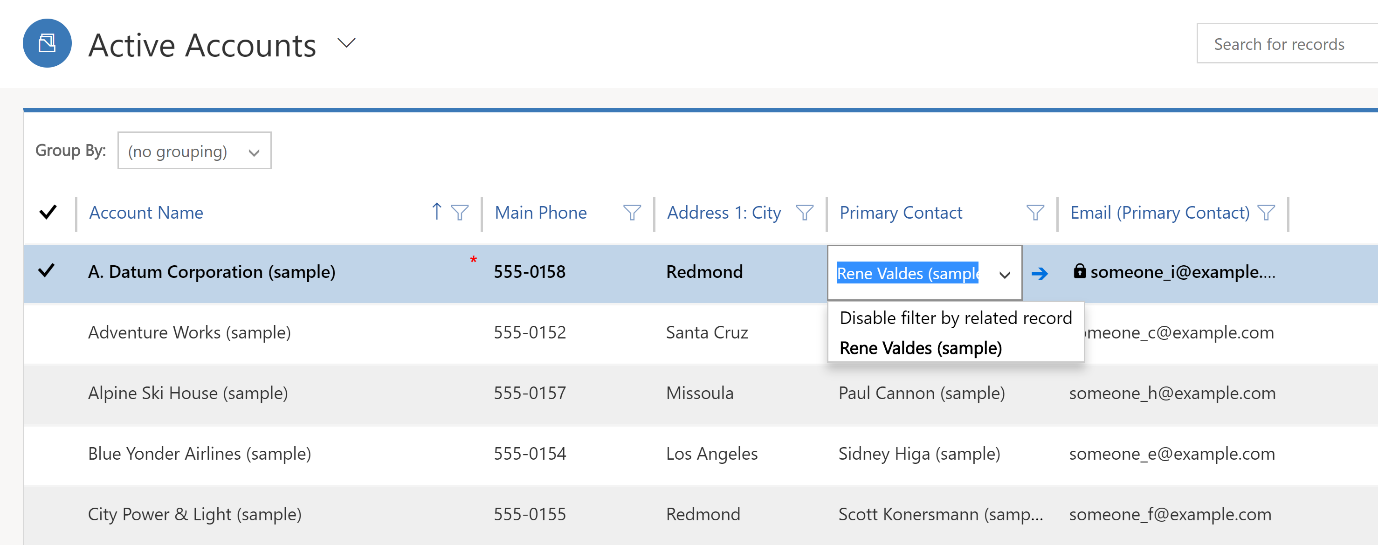
By default, users can’t enter data directly using the read-only view control for views in Microsoft Power BI. Users select the row in the grid to open a form, edit the data, and then save, which requires multiple steps. With editable grids from Microsoft Power BI consulting services, users can do rich in-line editing directly from views whether they’re using a web app, tablet, or phone.
When editable grids are enabled through the editable grid control in Microsoft Power BI, users can edit the data inside most types of columns, including basic Lookup columns and choices. This avoids the need to navigate to a form.
With editable grids from Microsoft Power BI consulting services, users can do rich in-line editing directly from views whether they’re using a web app, tablet, or phone. The Microsoft Power BI consulting services team can help enable editable grids to optimize the data entry process.
Steps Make views editable:
1. Sign in to Power Apps.
2. Select Solutions, open the solution you want, and then on the toolbar select Switch to classic. This opens solution explorer in a new browser window.
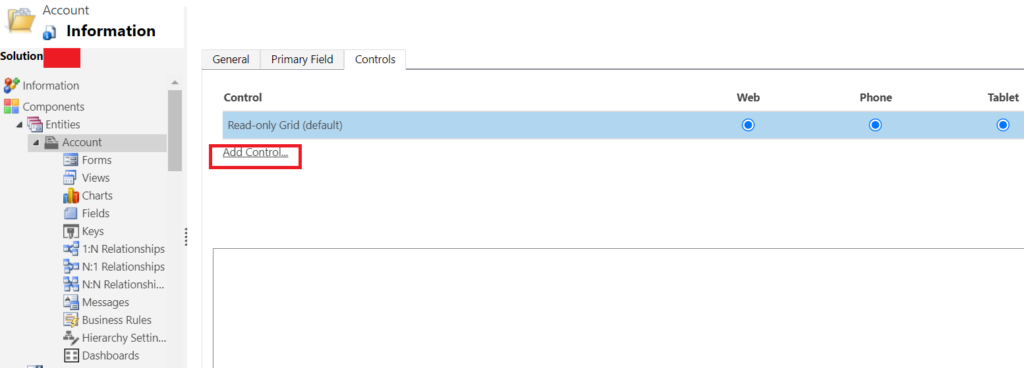
3. In the Entities list (these represent Dataverse tables), open the table you want, select the Controls tab, and then select Add Control.
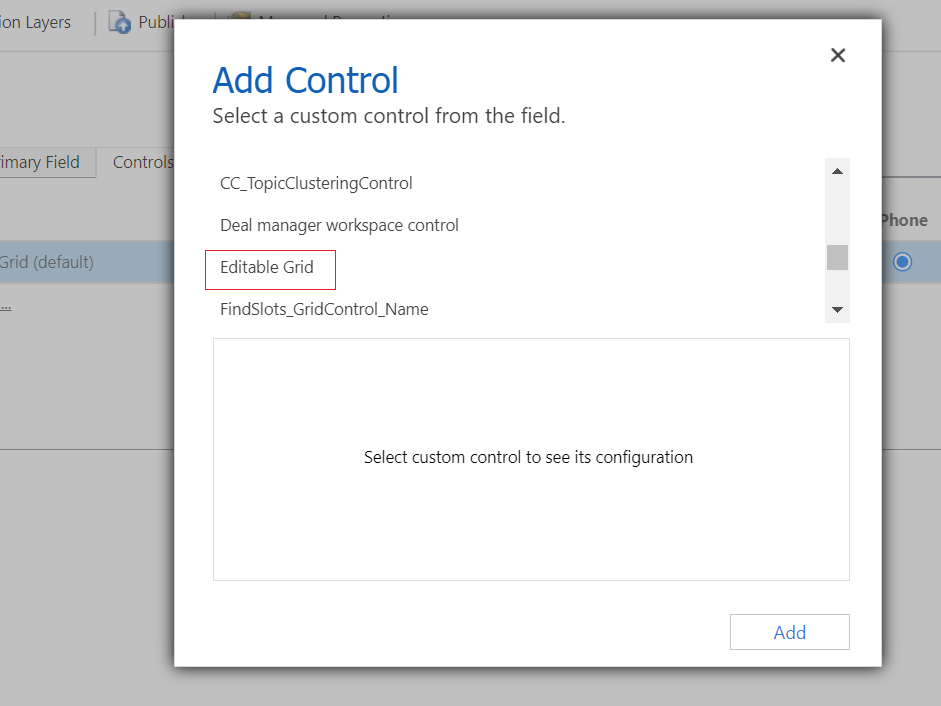
4. In the Add Control dialog box, select Editable Grid, and then select Add.
5. In the Editable Grid row that’s added, select the form factor(s) you want to apply the grid to. This makes the editable grid control the default control for the selected form factor(s). As a minimum in most instances select Web.
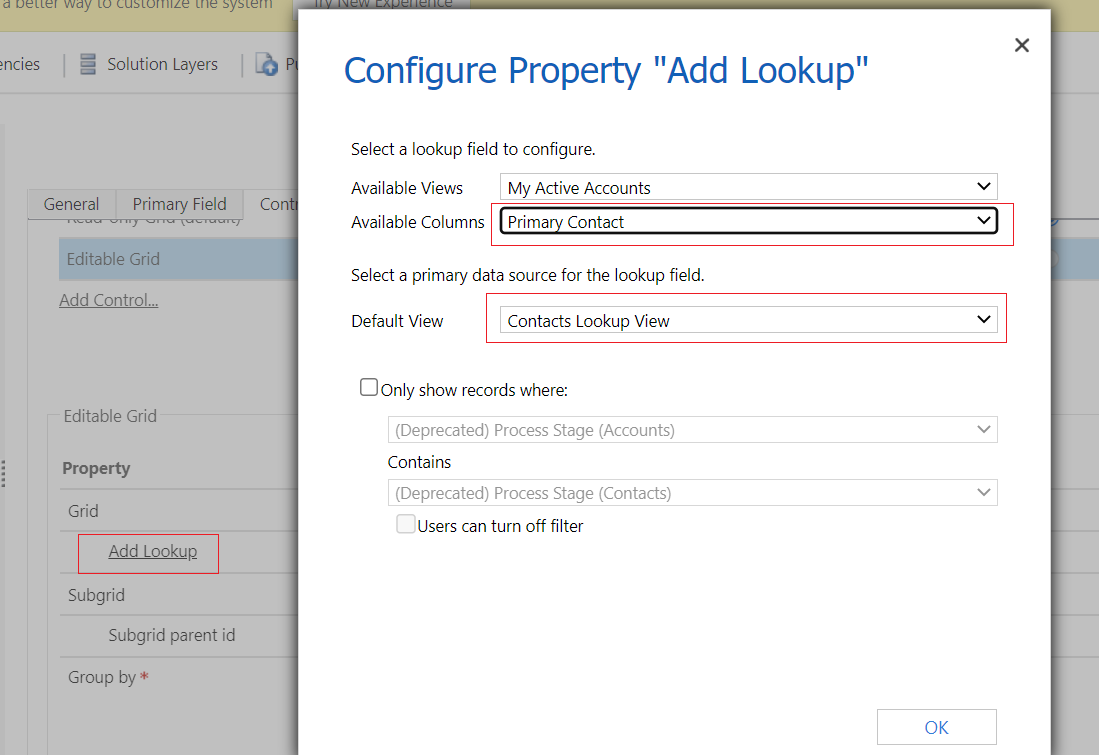
6. To add a lookup, in the Editable Grid option group, select Add Lookup, and then in the Configure Property “Add Lookup” dialog box:
a. In the Available Views list, select the view to add the lookup to (for example, select My Active Accounts).
b. In the Available Columns list, select the lookup column to add (for example, select Primary Contact).
c. In the Default View list, select the data source for the lookup column.
d. If you want to limit the rows displayed, select the Only show rows where check box, and then select your criteria from the list, and then select OK.
7. If you have a nested grid, select the pencil button for Nested grid view, and then select the table and view for the nested grid. For the Nested grid parent ID select the relationship for the tables. For example, the ParentAccountID column connects the Account and Contact tables.
8. If you don’t want to allow the user to group data by any column in the view (you want to save space, for example), in the Group by Column row, select the pencil button, and then in the Configure Property “Group by Column” dialog box, select Disabled, and then select OK.
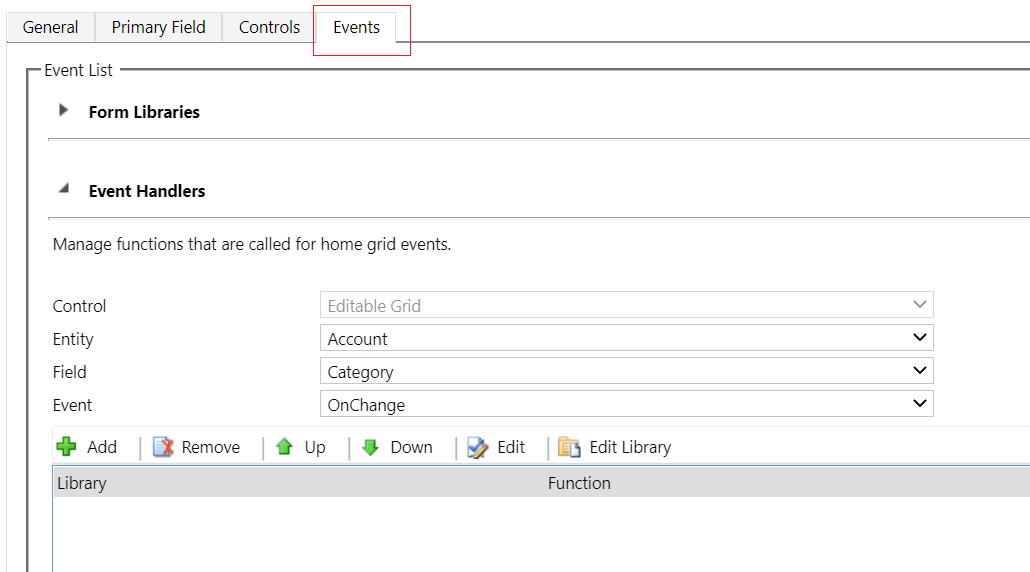
9. If you want to add JavaScript events, select the Events tab, and then select the appropriate tables, columns, and events.
10. To save your work, select Save on the action bar.
11. When you’re ready to make changes available to your team, select Publish on the action bar.
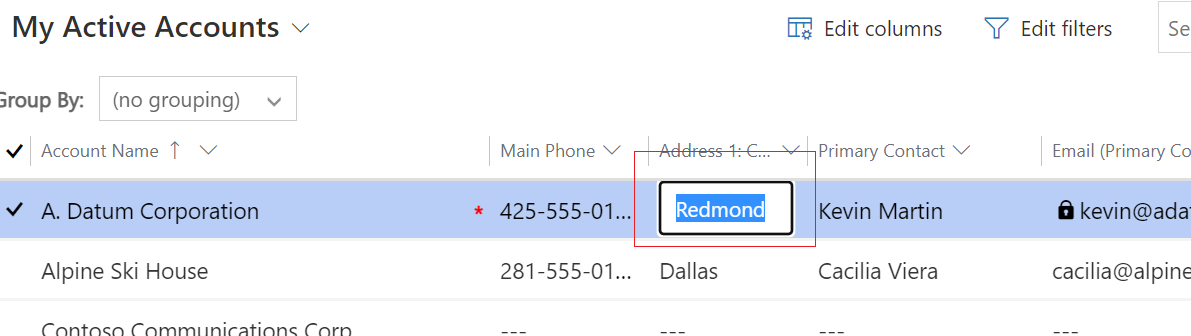
12. To test your changes, go to the view you specified in step 5, and then make some in-line editing changes.
More information: Developer Documentation: Use editable grids
For more information on leveraging Microsoft Power BI’s capabilities, please contact our expert team of consultants at Schwettmanntech Consulting Services by phone at (+91) 8886155998 or email at dillip.parida@schwettmann.in.